
Introduction
Hammerspace has partnered with Dell and Arrow Electronics to deliver the Global Data Platform software as a series of appliances based on Dell server hardware.
In order to provide sample configurations that span various performance requirements and capacity points, Hammerspace has defined two types of appliances that combine specific metadata servers and data servers:
- Throughput-Optimized Appliances are based on a 1U, 10-drive (1U10) server form factor, and are designed to maximize throughput per rack unit.
- Flash-Capacity-Optimized Appliances are based on a 2U, 24-drive (2U24) server form factor, and are designed to maximize flash capacity per rack unit.
For each of these types of appliances, a small, medium, and large configuration was defined, resulting in the six configurations shown below.
This Reference Architecture document provides more detail on these pre-defined appliances, including how they were selected, additional details on capacity, networking, and performance, and the Bills of Material (BOMs) for each appliance.
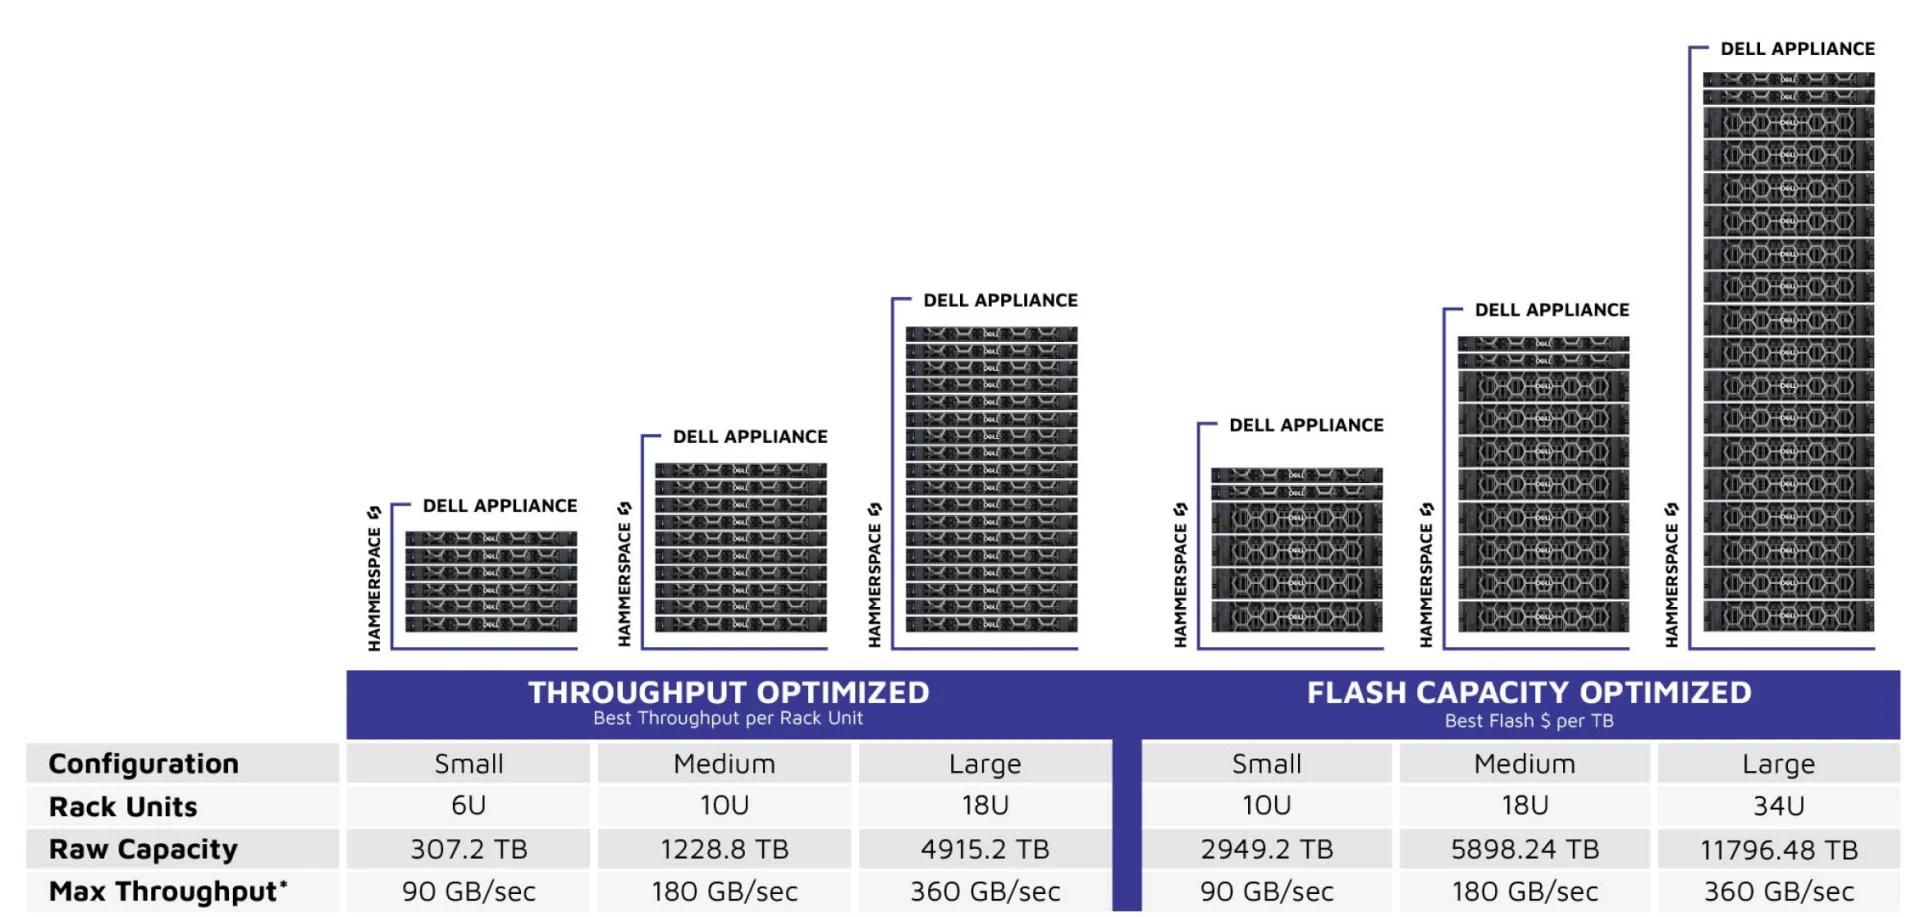
*Maximum throughput is shown based on 200GbE networking. Performance will vary based on a number of factors, most notably network speeds.
Building the Appliances Based on Specific Metadata and Data
Servers
Hammerspace can be configured to address a broad range of performance and capacity needs, including the extreme levels of performance required in AI and HPC workloads. Metadata and data servers are scaled independently using the server types shown below.
| Server Types | Metadata Servers | Data Services (DSX) Nodes | Linux Storage Servers |
|---|---|---|---|
| Description | Anvil Metadata Servers | Data Services (DSX) Nodes | Linux Storage Servers |
| Function | Runs Hammerspace Anvil metadata services | Used to scale out client access, scale performance, provide cross-platform data services, and provide multi-protocol access via NFSv3, SMB, and S3 protocols | Used to scale performance and capacity when clients access storage directly using the Parallel NFSv4.2 protocol, or scale capacity when building storage clusters based on commodity servers |
| Form Factor | 1U 10-Drive | 1U 10-Drive 2U 24-Drive | 1U 10-Drive 2U 24-Drive |
| Processor Options | Intel or AMD | ||
See the Dell Servers Datasheet for the specifications of all of these servers. As noted above, each of these server models is available with either Intel or AMD CPUs. All of these appliances have been designed with the Intel CPU server models.
Each appliance is comprised of (2) Anvil Metadata Servers, plus some number of data servers, as summarized in the tables below:
Throughput Optimized Appliances
| Configuration | Small | Medium | Large |
|---|---|---|---|
| Metadata Servers | Intel 1U Small Anvil Metadata Server 2x 1.6TB | Intel 1U Med Anvil Metadata Server 4x 1.6TB | Intel 1U Large Anvil Metadata Server 4x 3.2TB |
| Data Servers | Intel 1U Small DSX 10 Bay Server | Intel 1U Medium DSX 10 Bay Server | Intel 1U Large DSX 10 Bay Server |
| Metadata Server QTY | 2 | 2 | 2 |
| Data Server QTY | 4 | 8 | 16 |
| SSDs per server | 10 | 10 | 10 |
| Total Rack Units | 6 | 10 | 18 |
Flash-Capacity-Optimized Appliances
| Configuration | Small | Medium | Large |
|---|---|---|---|
| Metadata Servers | Intel 1U Small Anvil Metadata Server 2x 1.6TB | Intel 1U Med Anvil Metadata Server 4x 1.6TB | Intel 1U XLarge Anvil Metadata Server 512GB RAM 4x 6.4TB |
| Data Servers | Intel 2U Small DSX 24 Bay Server | Intel 2U Medium DSX 24 Bay Server | Intel 2U Large DSX 24 Bay Server |
| Metadata Server QTY | 2 | 2 | 2 |
| Data Server QTY | 4 | 8 | 16 |
| SSDs per server | 24 | 24 | 24 |
| Total Rack Units | 10 | 18 | 34 |
Capacity Options and NVMe Drive Selection
The data servers are either a 1U10 drive server model, or a 2U24 drive server model. For each of these models, Dell offers a variety of NVMe SSDs – both Mixed Use SSDs and Read Intensive SSDs across a variety of capacity points, displayed in the matrix below.
| Throughput Optimized | Flash Capacity Optimized | |||||
|---|---|---|---|---|---|---|
| Configuration | Small | Medium | Large | Small | Medium | Large |
| Data Server QTY | 4 | 8 | 16 | 4 | 8 | 16 |
| SSDs per server | 10 | 10 | 10 | 24 | 24 | 24 |
| Total Rack Units | 6 | 10 | 18 | 10 | 18 | 34 |
| Capacity Options | ||||||
| Mixed Use SSDs | ||||||
| 1.6 | 64 | 128 | 256 | 153.6 | 307.2 | 614.4 |
| 3.2 | 128 | 256 | 512 | 307.2 | 614.4 | 1228.8 |
| 6.4 | 256 | 512 | 1024 | 614.4 | 1228.8 | 2457.6 |
| Read Intensive SSDs | ||||||
| 1.92 | 76.8 | 153.6 | 307.2 | 184.32 | 368.64 | 737.28 |
| 3.84 | 153.6 | 307.2 | 614.4 | 368.64 | 737.28 | 1474.56 |
| 7.68 | 307.2 | 614.4 | 1228.8 | 737.28 | 1474.56 | 2949.12 |
| 15.36 | 614.4 | 1228.8 | 2457.6 | 1474.56 | 2949.12 | 5898.24 |
| 30.72 | 1228.8 | 2457.6 | 4915.2 | 2949.12 | 5898.24 | 11796.48 |
| 61.44 | 2457.6 | 4915.2 | 9830.4 | 5898.24 | 11796.48 | 23592.96 |
For these appliances, we selected Read-Intensive SSDs at the capacity points highlighted in green in the table above. The factors that went into making these selections include:
- Read-intensive SSDs are generally more widely used and deployed in enterprise storage systems
- The capacities selected were influenced both by overall mix and adoption, considerations for best $ per TB, and selecting appliances to represent a typical range of capacity points requested by our customers.
Important: Note the largest appliance defined here is 16 data servers with 24x 30.72TB NVMe SSDs, which equates to just under 12 PBs of raw capacity. Hammerspace software can scale to 1000s of nodes in a single storage cluster, and can scale to Exabytes of data, with linear performance scalability.
If you are configuring a Hammerspace storage cluster using Dell servers, our teams can help to select any of the drive options above to suit your specific performance and capacity needs.
Networking Options and Considerations
Each of the Dell servers specified for both Anvil Metadata servers and the DSX/LSS Data Servers can be config ured with 25GbE, 100GbE, 200GbE, or 400GbE network cards.
The choice of networking has a big impact on the overall throughput of the system, as discussed next the Perfor mance Considerations section of this document.
Performance Considerations
The table below shows the maximum read and write throughput of each data server, and each appliance, for each of the four networking options.
| Throughput Optimized | Flash Capacity Optimized | |||||
|---|---|---|---|---|---|---|
| Configuration | Small | Medium | Large | Small | Medium | Large |
| Data Server QTY | 4 | 8 | 16 | 4 | 8 | 16 |
| SSDs per server | 10 | 10 | 10 | 24 | 24 | 24 |
| Networking (GbE) | Max Write Throughput per Server (GB/sec) | Max Write Throughput per Server (GB/sec) | ||||
| 25 GbE | 2.8 | 2.8 | 2.8 | 2.8 | 2.8 | 2.8 |
| 100 GbE | 11.3 | 11.3 | 11.3 | 11.3 | 11.3 | 11.3 |
| 200 GbE | 22.5 | 22.5 | 22.5 | 22.5 | 22.5 | 22.5 |
| 400 GbE | 45 | 45 | 45 | 45 | 45 | 45 |
| Networking | Max Read Throughput per Server (GB/sec) | Max Read Throughput per Server (GB/sec) | ||||
| 25 GbE | 2.8 | 2.8 | 2.8 | 2.8 | 2.8 | 2.8 |
| 100 GbE | 11.3 | 11.3 | 11.3 | 11.3 | 11.3 | 11.3 |
| 200 GbE | 22.5 | 22.5 | 22.5 | 22.5 | 22.5 | 22.5 |
| 400 GbE | 45 | 45 | 45 | 45 | 45 | 45 |
| Networking | Max Write Throughput per Appliance (GB/sec) | Max Write Throughput per Appliance (GB/sec) | ||||
| 25 GbE | 11.3 | 22.5 | 45.0 | 11.3 | 22.5 | 45.0 |
| 100 GbE | 45.0 | 90.0 | 180.0 | 45.0 | 90.0 | 180.0 |
| 200 GbE | 90.0 | 180.0 | 360.0 | 90.0 | 180.0 | 360.0 |
| 400 GbE | 180.0 | 360.0 | 720.0 | 180.0 | 360.0 | 720.0 |
| Networking | Max Read Throughput per Appliance (GB/sec) | Max Read Throughput per Appliance (GB/sec) | ||||
| 25 GbE | 11.3 | 22.5 | 45.0 | 11.3 | 22.5 | 45.0 |
| 100 GbE | 45.0 | 90.0 | 180.0 | 45.0 | 90.0 | 180.0 |
| 200 GbE | 90.0 | 180.0 | 360.0 | 90.0 | 180.0 | 360.0 |
| 400 GbE | 180.0 | 360.0 | 720.0 | 180.0 | 360.0 | 720.0 |
Performance Discussion and Considerations
- These numbers are based on the assumption that clients have a direct I/O path to the data servers using NFSv4.2, with Parallel NFS, which provides for a direct data path between client and storage.
- Writes go directly to disk. Reads typically come from memory, though if reads come from NVMe there should be sufficient performance to saturate the network. The servers have been specified with sufficient memory so that if your working set fits within the Linux Storage Server memory or DSX server memory in the cluster, then there is a high likelihood that most reads will come from the memory of the backend server(s).
- Each ‘per server’ throughput reflects the measured and observed maximum throughput for each networking choice. For example, 11.8 GB/sec is the maximum throughput achieved on a 100GbE network, when the drives are not the bottleneck.
- Importantly – these read and write throughput per server numbers are based on selecting NVMe SSDs with the best throughput – for example Kioxia TLC drives.
- In the 1U 10-drive servers, aggregate drive throughput may be a bottleneck if the individual drives do not have enough throughput – for example if a Solidigm drive only provides 3 GB/sec of throughput per drive, that would equate to 30 GB/sec of aggregate drive throughput for the server, in which case the full 47.2GB/sec of throughput would not be achieved on a 400GbE network.
- In the 2U 24-drive servers, the aggregate drive throughput greatly exceeds the network port throughput, so for these configurations the network ports are the bottleneck.